Beicology: Want to Know Which Factories Are to Blame for Bad Air? Check This Pollution Map
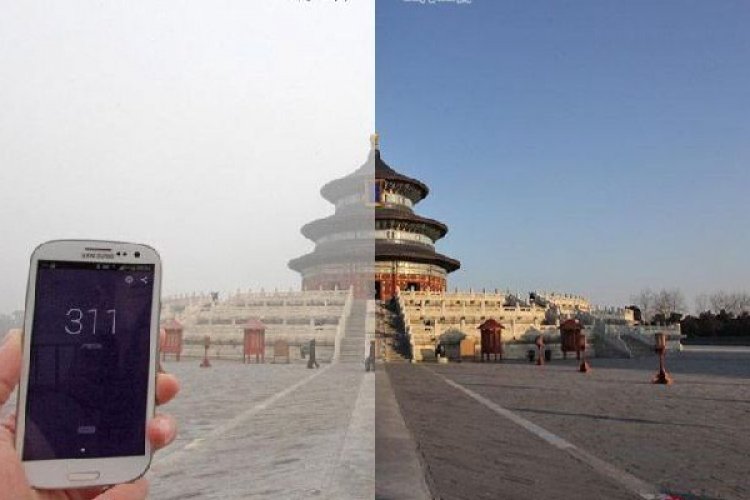
In Beijing, few questions are more contentious than: "What is the main culprit behind our smog?" Some of us insist that vehicles are to blame, while others swear that the source of our grey skies is coal burning at factories in neighboring cities.
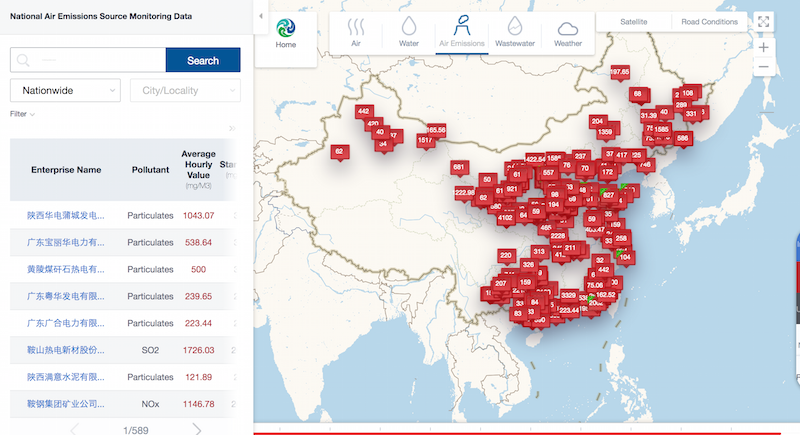
But anyone who doubts the damage done by these exhaust belching facilities need look no further than the Institute of Public & Environmental Affairs' (IPE) new pollution map for a reality check. The recently unveiled feature, which can be found on the Beijing based environmental research non-profit's website lays out which factories across China are emitting pollution, with regularly updated figures on their average hourly polluting value (mg/M3) and how that compares to regulatory standards (also in mg/M3).
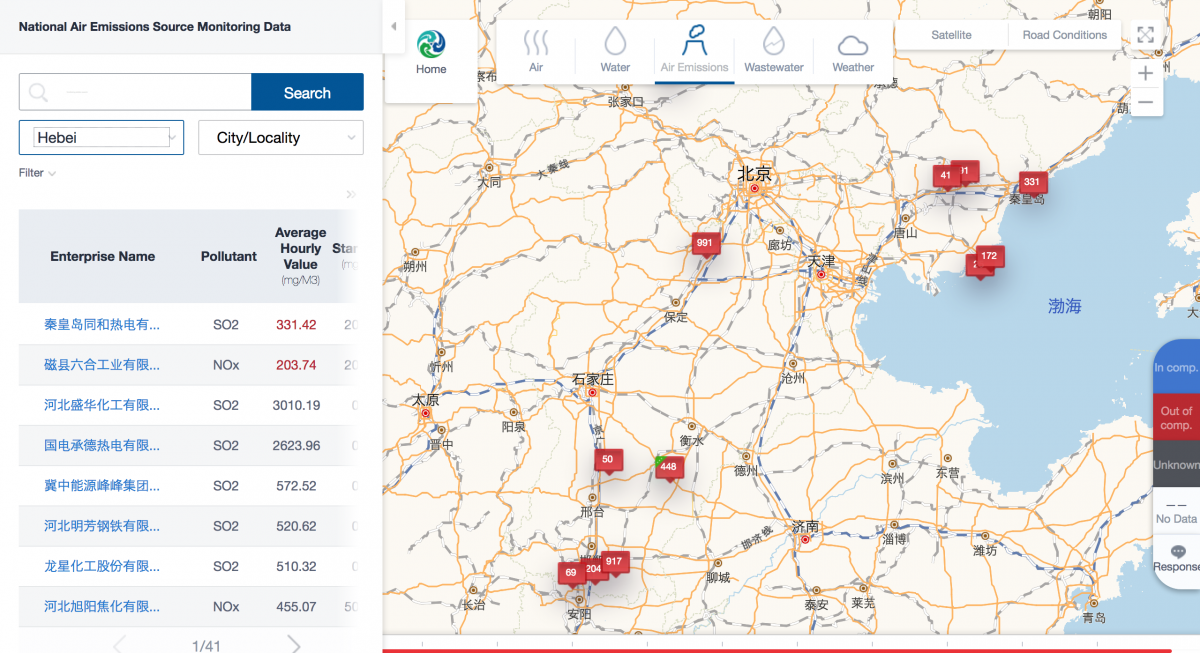
Heavy polluters show up in red, and the map can be searched based on province and also lists each factory's primary pollutant. For instance, a recent search of Beijing adjacent Hebei found that one factory in Handan was giving off NOx at an hourly rate of 252.77 mg/M3, well above the 200 standard, while another in Qinghuangdao had SO2 levels at 331.42, also past the the 200 standard.
Air quality geeks can also go even further with an advanced search filter for specific airborne toxins (sulfur dioxide, nitrogen oxide, and particulates), factory varieties (Key State-Monitored Pollution Sources, Non State-Monitored Pollution Sources, Listed Companies and/or Affiliated Enterprises), and a simpler search for factories exceeding or meeting standards.
One can only hope that monitoring technology like this keeps factories accountable, and reins in China's pollution levels – judging by recent reports, such incentives are still very much in need.
Email: kylemullin@thebeijinger.com
Twitter: @MulKyle
WeChat: 13263495040
Photos: IPE

