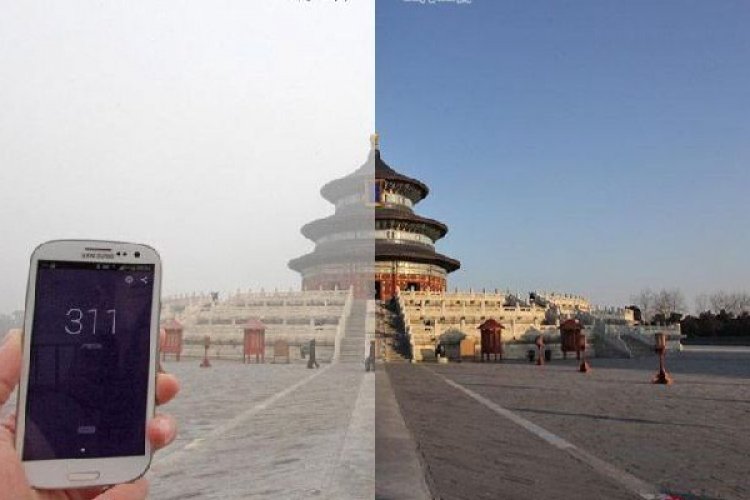
The Numbers Are In: 2020 Was the Best Year on Record for Beijing Air
Okay, we can all agree that 2020 sucked in many ways. However, there is one way in which it definitively did not suck: and that is in terms of air quality.
The full set of 2020 numbers are in, and for the sixth consecutive year, the air quality in Beijing has improved by leaps and bounds. The annual AQI reading for 2020 ended up at 78, a 10 percent improvement over 2019's final average of 87.
This also means that since 2014 (when data from the Ministry of Ecology & Environment became publicly available), the AQI has improved by 39 percent.

While its somewhat wishful thinking (as it is likely to get more challenging to make incremental improvements as the air gets progressively cleaner), we're on a pace to dip below AQI 50 – in other words, excellent quality air – by 2024.
Yes, China uses a method of AQI classification that is less stringent than the one used by the US EPA (though the scales converge after AQI 200). Anyhow, no matter how you slice it, the data clearly shows Beijing's air has been improving.

Part of 2020's good air can of course be attributed to a slowdown in economic activity as a result of COVID-19, though there is some question as to how much effect that actually had. However this past year is not an anomaly. The city government's concentrated efforts to clean the air via legislation on vehicle registration and emissions, as well as a reduction in coal consumption and moving polluting industries out of the capital has had a sustained, long-term effect.
Some of the other cool milestones from 2020:
- We set a new annual record for "Excellent" air – days rated AQI 50 or under – with 109. That blows away the previous record of excellent days in a year, set last year, with 85. That's more than double the number of Excellent days we had in 2015 (50).
- The two best months of the year were September and December, both of which ended up with an average AQI reading of 56 (if you want to dive deeper, September's average was 55.9 vs December's 56.3)
- The worst month was June, topping the year with an average AQI of 116, with July next at 99.
Here are the averages for each month of 2020:
- January: 86
- February: 89
- March: 63
- April: 75
- May: 85
- June: 116
- July: 99
- August: 80
- September: 56
- October: 72
- November: 66
- December: 56
The best seven-day stretch on record was during the Oct 1 holiday, from Sep 29 to Oct 5, when we averaged AQI 35, while the best single day of the year was Sep 11, when the AQI dipped to 22. We had two month-long stretches of Excellent air, where the AQI averaged 50 or below: the period of Sep 8 through Oct 5, and the days between mid-November and mid-December. But we had our bad stretches as well: Wednesday, Feb 12 was the worst single day, at AQI 257, while the seven-day period surrounding that date – Feb 7 to Feb 13 – was the worst week of the year, averaging AQI 177.
But this is a far cry from the way it used to be when bad air was the rule, not the exception. As recently as January 2017 we suffered our way through a full week when the AQI averaged 334. And has anyone been around long enough to remember Christmas Day 2015, when we breathed a day of AQI 485 air?
Here's to an even cleaner 2021.
READ: Beicology: Study Finds Beijing is One of China’s Best Places for Preserving Biodiversity
Images: Uni You, Michael Wester


