PM 2.5, Beijing's Bugbear of Bad Air, Drops Again For Another Record Low in 2021
Once again Beijing showed a year-on-year improvement in air quality, according to the latest World Air Quality Report from IQAir.
The annual report is based on PM2.5 air particulate pollution data gathered from 106 different countries, a mix of official government monitoring stations and individual monitors operated by local residents, non-profit organizations, and corporations.
The report measures PM 2.5 – particulate matter consisting of fine aerosol particles measuring 2.5 microns or smaller in diameter – because, as it states, PM2.5 is “commonly accepted as the most harmful to human health due to its prevalence in the environment and broad range of health effects.”
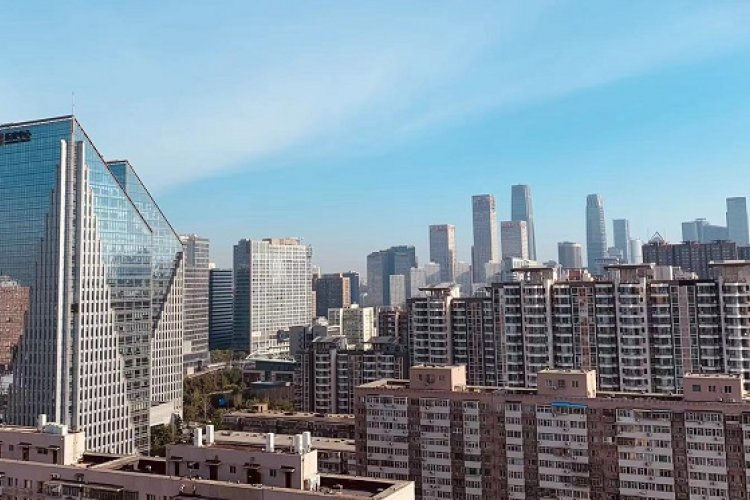
Beijing’s PM 2.5 concentration in 2021 dropped from 37.5 to 34.4, which, while only a gradual improvement, is still a trend downward, which is exactly the direction we like to see.
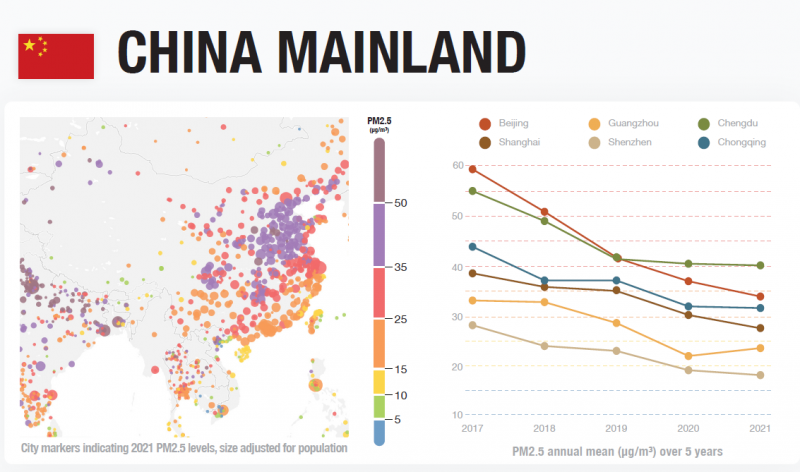
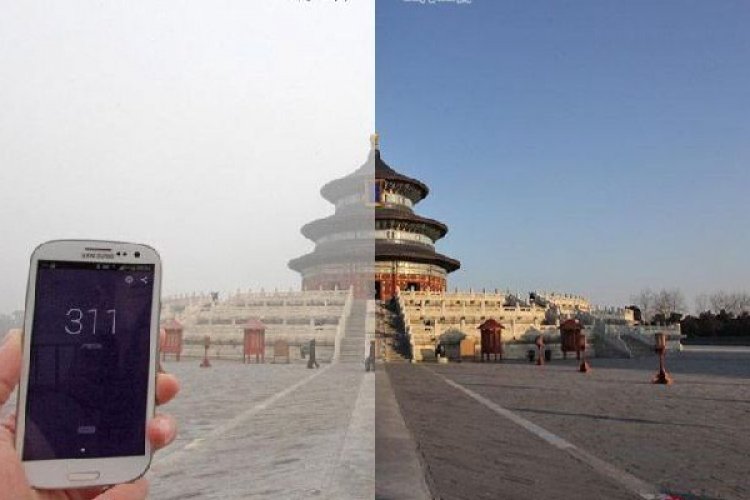
What’s more, we reported last year that Beijing ranked #241 on the list of world’s worst cities for PM 2.5 air pollution, but thanks to cleaner skies in 2021 (even factoring in the March airpocalypse we had that turned skies a similar hue to that of Las Vegas in the film Blade Runner 2049) that ranking has fallen to #335.
Once the poster boy for bad air, Beijing doesn't even crack the top 150 most polluted cities in China anymore. Currently ranked the 155th in China, Beijing now has better air than Suzhou, Chengdu, Xian, Shenyang, Zhengzhou and Tianjin, just to name a few.
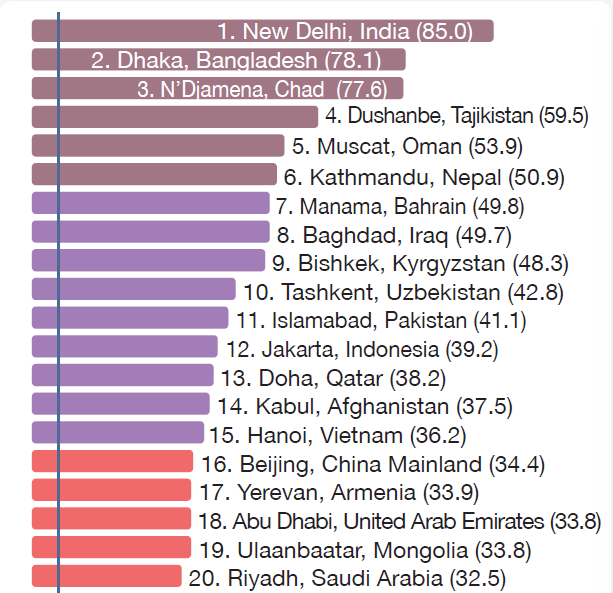
When comparing across the world's capital cities, Beijing is still pretty bad, but there's still 15 other capitals ahead of us. New Delhi is now the world's capital of bad air, followed by the capital cities of Bangladesh, Chad and Tajikistan. At #16, Beijing still has cleaner air than Hanoi, Jakarta, Kathmandu, Doha and others.
While this is all well and good, the report also highlights the challenges both Beijing and China in general face in continuing the fight against PM2.5. The biggest culprit for the country’s high PM2.5 levels is coal, the report says, along with industrial sources and motor vehicle emissions. It continues that coal is used to produce 60 percent of China’s electricity, and that even though the “government has pledged to reduce coal usage for electricity generation by 1.8 percent before 2025… coal continues to be a significant environmental and health hazard in China.”
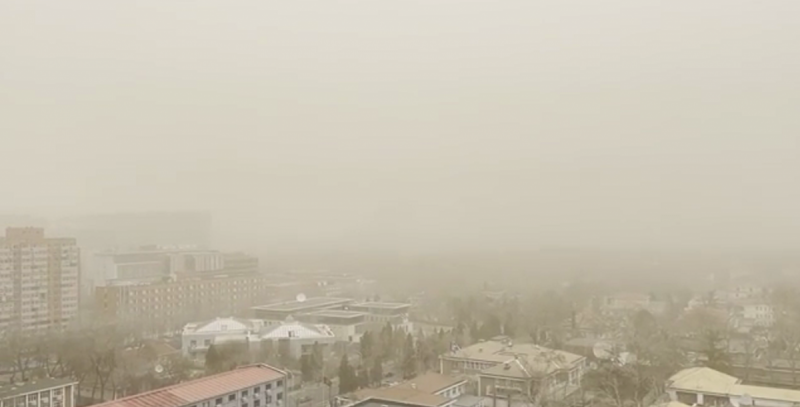
Another factor is seasonal sandstorms due in part to desertification and other factors in Northern China, with the report citing the massive March 2021 sandstorm, with the sky discoloration brought with it being “an indicator of PM2.5 concentrations at ten times the WHO’s recommended daily limit.”
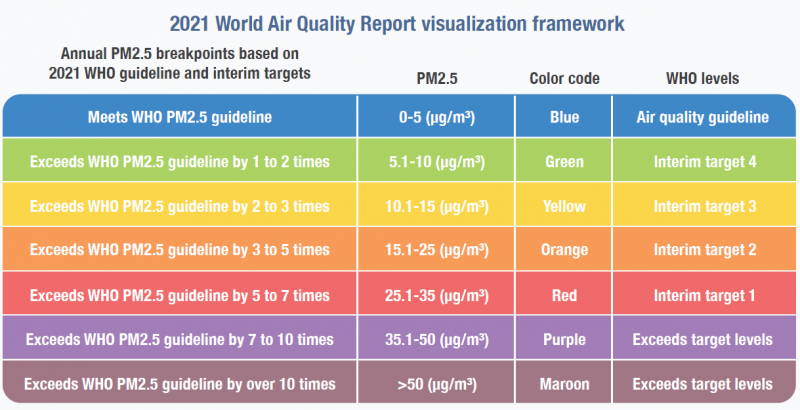
This year the report takes into account the WHO’s updated PM2.5 level guidelines, the first update since 2005: recommended PM2.5 levels were halved from 10 μg/m3 to 5 μg/m3.
The report also uses a new color coding system based on WHO guidelines to visualize the status of bad air in a more intuitive manner, as outlined in the chart below:
Using those bands, we can now see how Beijing stacks up in terms of percentage of time spent in the various zones:

While 12 percent is precious little time in the "meets WHO guidelines" territory, you can see it growing year on year. More impressively, the time in the gross brown zone has declined drastically.
READ: Feast Your Eyes on Beijing's Blue Skies Now That We've Notched the Best Year for Clean Air on Record
Images: IQAir, The Beijingers, Uni You, Anna Pellegrin Hartley


